Backtesting Ben Graham’s net-net investment strategy in US markets from 2004-2024
US Public Equity Research

Abstract
Using Nasdaq’s Sharadar public equity API, which includes data on fundamentals (from sec filings) and price (from NASDAQ and NYSE), I back-tested an investment strategy that invested only in US common stock equities (with no preferred) trading below 65% of net current asset value, a debt to tangible ratio below 1 and selling after one year. I excluded industries where such an approach is not recommended. I excluded stocks with preferred shares. I included stocks with a 5 day average daily trading volume above 1000 shares.
I measured 605 investments during that time period. This strategy excludes dividends, buyouts, mergers, takeunders (whose final price went to zero, and of which there were relatively few). With this approach I found that investing in this basket of opportunities yields an arithmetic average return of 55%, but a real total return of -40%. Results were very lumpy by year, varying in market condition. My research suggests that Ben Graham’s strategy (or investing in distressed equities generally) is still a sound one, but only when applied to distressed markets.
Background
Benjamin Graham is the father of value investing, his disciples have produced outstanding returns (greater than the market) in the period since 1936-1956. Some colloquially refer to his style as “cigar butt investing”.
This research builds on the work of others who have backtested Graham’s ideas in modern markets.
Xiao and Arnold found a small number of stocks in the UK that met Graham’s criteria from 1980-2000
During that period they found a 19.7% annualized return when holding cigar butt stocks for 5 years on the London stock exchange. https://papers.ssrn.com/sol3/papers.cfm?abstract_id=966188
“Ben Graham’s Net Current Asset Values: A Performance Update” examined the performance of securities that were trading at no more than two-thirds of their “net current asset value (NAV)” during the 13 year period from 1970-82 period in the US. The study reported gross returns that were more than triple the returns of the S&P 500 TR.
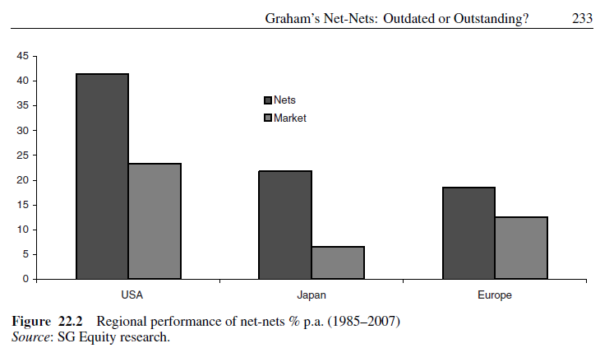
Montier found that a net-net strategy outperformed the market average in 3 regions.
Merani questions the above studies on alpha architect and reviewed 10 strategy in total indicating outperformance of Graham’s strategy:
Merani pointed out the common errors made in these studies:
1. Inflated return bias (using arithmetic mean and not geometric).
2. Un-investable stock bias (low trading volume).
3. Survivorship bias.
I took these critiques into consideration in my design.
Graham’s Net-Net Investment Criteria
Ben Graham’s strategy as presented by John Traine (based on his writings) were:
Buy Criterion 1:
A stock should be bought for less than two-thirds of its net current assets giving no weight to fixed assets and deducting all liabilities in full, and sold at 100 percent of net current assets.
The company should owe less than it is worth. This is the debt to tangible equity ratio should be less than 1, counting preferred stock as debt;
Buy Criterion 2a:
The earnings yield (the reciprocal of the price-earnings ratio) should be twice the prevailing AAA bond yield.
Buy Criterion 2b:
The dividend yield should be no less than 2/3rds of the AAA bond yield.
A purchase would be made if criteria 1 was met and either criteria 2a or 2b was met.
Sell signals:
Sell after your stock has gone up 50 percent.
Sell if the dividend is omitted.
Sell when earnings decline so far that the current market price is 50% over the new target buying price.
Sell after 2 years, maximum.
Methods
I found that 0 opportunities existed for criteria 1+2a, and only 33 existed for criteria 1+2b.
However, I’ve also read that Graham would be less conservative when using a broader basket of securities. As in, a portfolio that meets both the buy conditions above would only need to be 10 securities, while a riskier portfolio based on criteria 1 alone could be used if constructed to be larger (30+).
So out of necessity I just tested criteria 1, as follows:
A stock should be bought for less than two-thirds (66%) of its net current assets giving no weight to fixed assets and deducting all liabilities in full.
A debt to tangible asset ratio below 1.
No preferred shares (I currently don’t have a way to calculate preferred share count and preferred share price, so I excluded any instance of companies with preferred shares).
And simplified my sell signals to just holding for 1 year (addressing Merani’s concern over arithmetic means).
I also accounted for Merani’s concerns and:
Used data that included delistings, driving the stock price to 0 in my data (However this is also inclusive of takeunders, buyouts and mergers, so this may under report results). But this will be a conservative method that will prevent survivorship bias.
Used a holding period of 1 year. Presented results by year, with a geometric mean calculated based on annual performance.
Invested only in stocks with a significant volume. In my case a 5 day average of at least 1000.
Stock prices were taken from the closing price of the day.
My exclusions were:
1. Industry exclusions based on sic code. (removing speculative, capital light or highly regulated, capital-intensive, complex liabilities, many intangible assets.)
1000- 1500 Mining, Oil & Gas Extraction
2833- 2837 pharmaceuticals and preparation
4900- 5000 Utilities & Infrastructure
4810, 4900 Telecommunications
6000, 6999 Financial Services (Banks, Insurance)
6500, 6800 Real Estate
Also excluding:
SIC Code 4400: Water Transportation
SIC Code 8742: Management Consulting Services
And certain speculative or capital light industries:
‘Biotechnology’, ‘Credit Services’, ‘Diagnostics & Research’, ‘Drug Manufacturers – Major’, ‘Drug Manufacturers – Specialty & Generic’, ‘Electronic Gaming & Multimedia’, ‘Entertainment’, ‘Gambling’, ‘Health Information Services’, ‘Internet Content & Information’, ‘Publishing’, ‘Security & Protection Services’, ‘Software – Application’, ‘Software – Infrastructure’, ‘Medical Distribution’, ‘Pharmaceutical Retailers’, ‘Capital Markets’
And industries I don’t invest in:
Airlines’, ‘Auto Manufacturers’, and ‘Marine Shipping’,
Essentially I focused my industries mainly on manufacturing as Graham did.
2. I only looked at companies listed on NYSE, or NASDAQ (this research does not include OTC)
3. I only looked at fundamental data denoted in USD.
4. I only looked at companies listed in the U.S.
5. I only had share price data through September 2024, so given a 1 year holding period I only looked at stocks bought between Jan 1 2004 and Dec 31 of 2022
Note: For some investments the sell date exactly one year later was a date when the market was closed, so to calculate sale price, I took the average closing price of the dates with data for a period +5 days after the anniversary date.
My analysis was done in BigQuery (Google Cloud Platform) with SQL.
Findings

(Fourth column is assuming you invested $1000 in 2005)
Discussion
I’ll first note that Merani’s concerns over the arithmetic mean are justified. The difference here between arithmetic return and total return is huge.
I found this data exploration very interesting and I conclude that modern cigar butt investing only really works in distressed markets. In bull markets with low interest rates, this strategy will only yield you companies undergoing massive share dilution, speculative companies, fraudulent companies or ones that have a huge cash burn even in good conditions. The market correctly values these distressed companies in boom times as likely to burn through their excess NCAV soon, and so discounts their value appropriately. On the flip side, markets irrationally discount during the bust times.
For example here are the companies that are in my screener today 1/3/2025:
MSN, BJDX, RPID, SPGC, BTTR, AQB, MGOL, CTHR, NXU
These are terrible companies, either speculative startups or established companies marked by fraud or an imploding business model.
I tried many ways to find an angle to invest in U.S. cigar butts in the boom years and could not. I tried excluding companies diluting shares, companies with a negative ebit greater than the market discount, companies that traded below NCAV for the first time only, but I could not find a way to make it work. But I will likely revisit this screener during the next credit crunch.
As I went through each of the stocks measured during this period, very few maybe 5%, would be investable for me a priori. Dirt from Dirtcheapstocks says he thinks that number is closer to 3%. You should check out that article next if you are curious.
This research shows that Ben Graham’s strategy of buying a broad basket of net-nets now isn’t practical within the NYSE/NASDAQ US Domestic Common Stock universe.
I think it is important to consider many valuation models in your analysis, but I am starting to think that liquidation value won’t be my main focus. Graham’s focus on earnings yield has become much more important to me in my investment considerations.